|
The purpose of this exercise is to help
students understand something that is new to
them (H-R Diagram) by using something they
are very familiar
with (food). Although the H-R Diagram is
an important concept in astronomy, many
students have a difficult time
understanding that it is a tool used to classify
stars. This introductory exercise will help
them understand that it isn't a map or picture of the stars, but rather a way to classify them.
First I ask students to think of
foods. Tell them to list two foods that are
good for them (their opinion). Also, have them list two that are bad for them, and two
that have average nutritional value. Next,
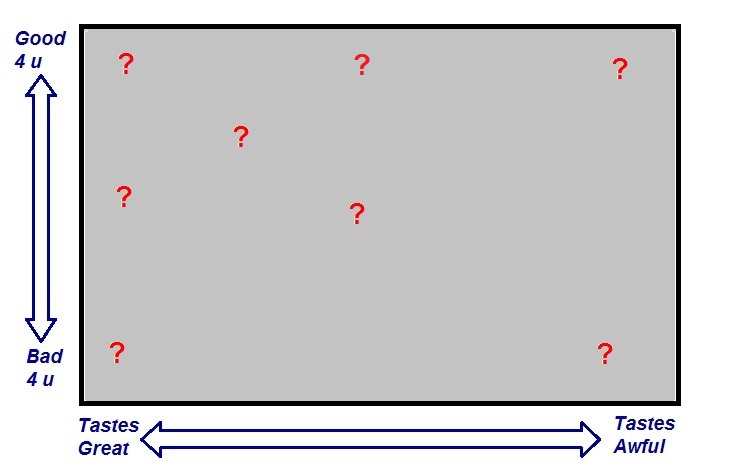
sketch a rectangle on the board and label it as
shown in the diagram below. Call on
individual students to give the name of a
food and tell where to place the name of
that food on the rectangle. Since there are a
wide variety of opinions when it comes to
foods, tell them that the placement is based
solely on the opinion of the person who is called
upon. As the exercise
continues, ask students to think of foods that
might be placed in the areas of the rectangle
that are empty. After several minutes I
point out that what we have been doing is
classifying foods based on two criteria. Now
they are ready to understand that the H-R
Diagram is simply a way to classify stars
based on two criteria . . . brightness and
temperature.
Move your cursor over the image to see some of my personal choices.
|


