
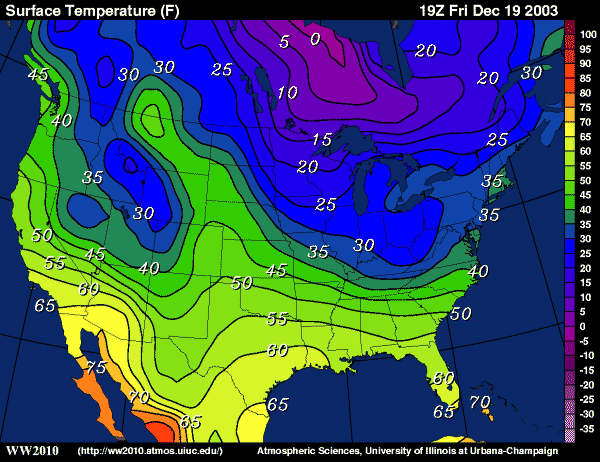
 Map Courtesy of the University of Illinois As a result of a strong Chinook effect at noon MST on December 19, 2003, Cut Bank and Great Falls recorded highs of 59 and 56 degrees respectively. Valier, 20 miles south of Cut Bank, reached 61 degrees. In contrast, Kalispell and Missoula only reached 23 and 31. The temperature map above shows that a large areas east of the Rocky Mountains experienced Chinook winds on that day, as evidenced by the warmer colors extending from Canada to Colorado. Below: When you compare the topography map below to the temperature map (above) you can see a strong correlation between the Chinook winds and the shape of the land. The warm winds develop on the east slope of the Rockies. In some places this area is called the "Rocky Mountain Front". 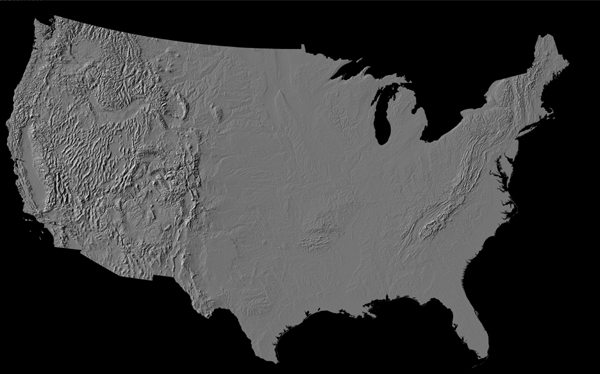 Map courtesy of NASA Not exactly . . . |
 |
Back to Chinook Effect |
|
This energy demo will help you understand the role of latent heat. |
|
Snow cover image shows the effect of Chinook winds |
|
Current Snow cover image |
|
Earth Science Teacher at Helena High School |