|
Precipitation
in Montana 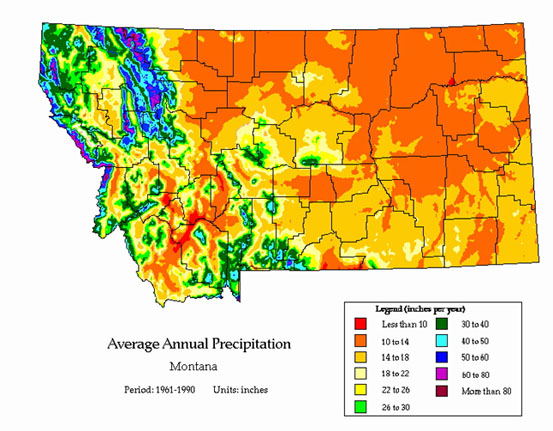
Precipitation Map Courtesy of Oregon
Climate Service A Correlation . . .
This map
shows average annual precipitation amounts
for Montana from 1961-1990. As you can see,
precipitation amounts vary greatly throughout
the state. If you were to compare the map
shown above with one that shows the
locations of mountains, you would see a
strong correlation between mountains and
areas of heavier precipitation. As air moves
across Montana, mountains make the air rise.
As it rises, the air cools by expansion. If there
is enough humidity (vapor) in the air, this
cooling will cause cloud formation and
precipitation. When mountains provide the lift
needed to cause precipitation, it is referred to
as "orographic" precipitation. On the other
hand, as air moves down into valleys, it
becomes warmer by compression. As a
result, valleys like the Helena Valley may get
less than 15 inches of precipitation per year,
whereas the surrounding mountains receive
much more.
Mountains make air rise. . .
The prevailing winds influence which side
of the mountains will have the most
precipitation. In Montana, winds usually blow
from west to east (the "westerlies"). For this
reason, the western slopes of the mountains
where air is rising can expect more
precipitation than the the eastern slopes
where air is sinking. A dramatic
example of this can be seen in the Glacier
Park area. There the westerlies encounter the
high mountains of the park, causing
tremendous amounts of precipitation to fall in
places like Logan Pass (over 80 inches of
precip.). Then as the air continues eastward it
descends into the Browning area where
precipitation is much less likely (less than 20
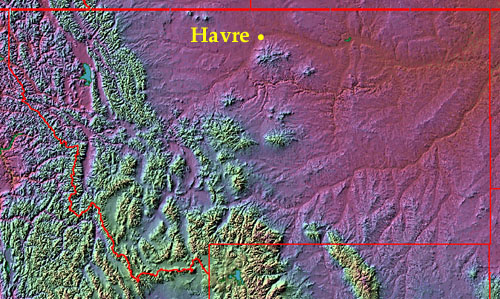
inches of precipitation). The image below shows the shape of the land. Compare it to the precipitation map above. Do you see a correlation?
Term: correlation
|

