|
Counterclockwise Flow Around a Mid-Latitude
Low
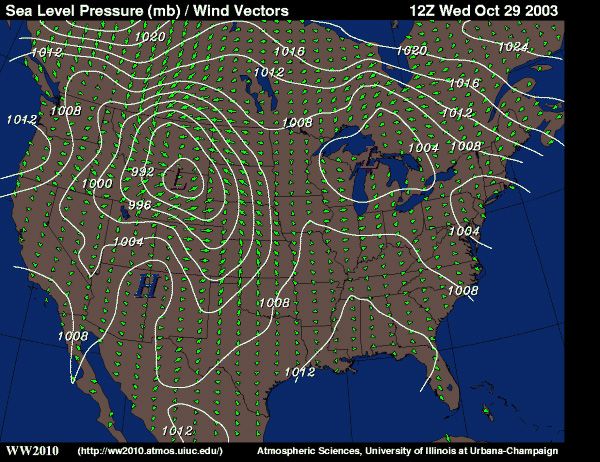
Map Courtesy of Atmospheric Sciences
Department, University of Illinois at
Urbana-Champaign
One very windy night in Montana . . .
A storm system swept through Montana
during October of 2003, bringing the state its
first taste of winter weather. The storm was a
type that textbooks call "mid-latitude cyclones"
or "mid-latitude lows". TV meteorologists refer
to them as "low pressure systems" or simply
"storm systems", perhaps because the word
"cyclone" sounds too frightening. The use of
the word "cyclone" indicates that the storm
has winds that spiral in a counterclockwise
direction toward a center of low pressure
(clockwise in the Southern Hemisphere).
Many of these low pressure systems cross
the state each year, especially in the fall and
spring. The type of weather they bring
depends on the amount of water vapor in the
air, as well as pressure and temperature
differences within the system.
The bull's eye tells the story . . .
Although the storm brought some snow and
much colder temperatures, one of its most
extreme characteristics was its strong wind.
Much of Montana experienced wind speeds
over 50 miles per hour as the storm crossed
the state during the early morning hours. The
white lines on map show that the storm was
centered on the Montana-Wyoming border at 5
am MST (12 Z) on October 29, 2003. These
lines, called isobars, are lines of equal
pressure, and in this case they make a huge
bull's eye extending from Texas to Canada
with the pressure decreasing toward the
center (L). Locations on the isobar closest to
the L were experiencing a pressure of
only 988 millibars (29.2 inches of mercury).
The pressure was low because this was the
center of region of rising air. The spacing of
the isobars also tells that the winds
associated with the storm were exceptionally
strong. Isobars that are close together
indicate a bigger difference in pressure over
distance (pressure gradient). It was this big
difference in pressure that caused the strong
winds. Based on the spacing of the lines,
winds at the time the map was made were
stronger in northeastern Montana than in the
central part of the state.
Check it out - Animation: low pressure system centered over Texas on March 22, 2012
Little green arrows . . .
The green arrows, which show wind direction,
reveal the distinct counter clockwise flow
around the center of the storm. At the time the
map was made (5 am MST), the winds in
northeastern Montana were out of the east,
whereas the winds in the southwestern part of
the state were out of the west. During the
night, as the storm's center swept across
from Idaho to Wyoming, the wind at each
location was determined by where the storm's
center was. For example, earlier in the night,
central Montana would have experienced
winds out of the southwest. Then, as the
storm's center passed through, the winds in
central Montana would have started to blow
out of the northwest.
Watch this Animation of a mid-latitude cyclone..
Term: pressure gradient
|

