|
"Blocking High" Forced Storms Away From Montana
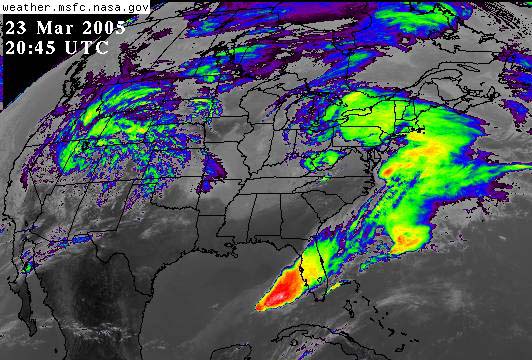 Image courtesy of N.O.A.A. and N.A.S.A.
High means dry. . .
Montana experienced an unseasonably warm, dry February in 2005 as a result of an area of high pressure that parked itself over the northwestern USA for much of the month. Areas of high pressure, sometimes called "high pressure systems", or just "highs", are places where air is sinking. As it sinks, the air is compressed and warmed, making high pressure days more likely to be clear with sunny days, cold nights, and very little precipitation. Weather systems generally move across Montana from west to east, typically passing through over a period of a few days. But the high of February 2005 stayed put for weeks, causing the jet stream and the storms that it guides go around Montana. High pressure sytems that do this are sometimes referred to as "blocking highs".
Back in the groove . . .
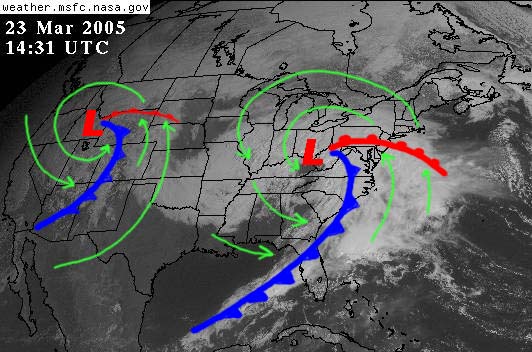
Finally in March the high dissipated and storms began to move across Montana once again, bringing much needed moisture to the state. The image above shows two major storms, one that affected the eastern USA and the another that brought significant snow to our state. Both storms were mid-latitude cyclones, usually just called "low pressure systems" (or "lows"). In disturbances such as these, air flows counterclockwise, rising as it spirals toward the center (L on image below). Whenever air rises, it cools by expansion, helping clouds (and precipitation) to form. Low pressure systems usually feature a fairly distinct cold front (blue, spiked line) where cold air is pushing into warmer air, and a less distinct warm front (red, bumped line) where warmer air is pushing into and over colder air. Both warm and cold fronts force the warmer air to rise and cool by expansion, helping clouds to form. Quite often the clouds in a low pressure system form a comma shape, especially in the eastern USA where there is more humidity (Gulf moisture) and no tall mountains to disrupt the motion of air within the system.
Watch the "Ultimate Cloud Demonstration" (3.5-minute video) to see the relationship between pressure and clouds.
Eyes in the sky . . .
Both images on this page were taken by N.O.A.A.'s GOES-East, a geostationary satellite that provides a view of the lower 48 states and the western part of the Atlantic Ocean. The GOES-West allows meteorologists to monitor storms over the Pacific as they approach the USA. Both satellites can produce three types of images, including infrared, water vapor, and visible. Infrared images, like the one at the top of this page, are important because they show where the coldest cloud tops are, the ones most likely to be causing precipitation. Also, infrared images do not depend on daylight as visible images do. At the time the above image was made it was snowing in Montana and there was significant rain and some areas of severe weather (red) in the east. Below: This "visible" image shows where there were clouds as the two storms made their way across the country. I estimated the location of the fronts and the direction of the winds (green arrows), and then added them to the image.
Just thought you'd like to know . . .
N.O.A.A. stands for National Oceanic and Atmospheric Administration. G.O.E.S. stands for Geostationary Operational Environmental Satellite.
Term: geostationary
|

